System Design 3 - Estimations
Third part of my system design train of thought
Introduction
After the previous 2 parts, we’ve got a reasonable idea of the tools we have at our disposal in system design and why it is important.
Before I’ll get to specific task designs, I’d like to wrap up the introduction with how to approach it.
This part is basically dedicated to chapter 3 & 4 of the book I’m using to guide myself through it. You can find these 2 parts here.
Back-of-the-envelope Estimation
So let’s start with estimations. How do we estimate something completely abstract? What does it mean if I’m supposed to design something for 1 million users?
Well, we first need to have an idea of the amount of data we’re transferring. To do that, we often talk about bytes. But millions of users creating twitter posts will have enormous numbers. What does it tell us that we store 1073741824 or 1073741424 bytes?
I’m sure you didn’t read those numbers, but the first one is 2^30 and the second is the 10^30 - 400. It doesn’t make a difference in designing. What does is the power of 2s.
| Power | Value | Full name | Short Name |
|---|---|---|---|
| 10 | Thousand | Kilobyte | KB |
| 20 | Million | Megabyte | MB |
| 30 | Billion | Gigabyte | GB |
| 40 | Trillion | Terabyte | TB |
| 50 | Quadrillion | Petabyte | PB |
So, now we’ve established some form of estimating the amounts of data we’re storing/trasnfering. That’s great, we can now say that we store 5 petabytes of data! But what does it mean for the speed?
Well, luckily there are more shorthands we could use.
Numbers every developer should know
There’s a list of numbers every programmer should know. Now, I don’t agree with “numbers every programmer should know”, but that’s because I’m lazy. I definitely won’t remember the entire list. Here are the numbers:
| Operation name | Time |
|---|---|
| L1 cache reference | 0.5 ns |
| Branch mispredict | 5 ns |
| L2 cache reference | 7 ns |
| Mutex lock/unlock | 100 ns |
| Main memory reference | 100 ns |
| Compress 1K bytes with Zippy | 10 µs (10 000ns) |
| Send 2kb over 1 Gbps network | 20 µs (20 000ns) |
| Read 1 MB from memory | 250 µs (250 000ns) |
| Round trip in datacenter | 500 µs (500 000 ns) |
| Disk seek | 10 ms (10 000 000 ns) |
| Read 1 MB from the network | 10 ms (10 000 000 ns) |
| Read 1 MB from disk | 30 ms (30 000 000 ns) |
| Send packet CA->NL->CA | 150 ms (150 000 000 ns) |
Now, let’s look at the list. Rather than remembering exact values, let’s compare the operations instead. Look for orders of magnitude:
- Memory is fast, disks are slow (250 µs from memory read is 120times faster than 10ms from disk)
- Sending a packet from California to the Netherlands and then back to California is SLOW (150ms for 4kb of data).
- Having local data centres is important.
- Global shared data is expensive
- Data centres are across different regions, at it takes time to transfer it between them
- Compressing data before sending them through network can save a lot of time
- Writes are 40 times slower than reads
- Make writes as parallel as possible, optimize for them
Let’s get here a really quick example of the above. Let’s consider we built a tool that shows images from disk. For simplicity, let’s do 30 images and consider that the images are 256KB in size
- Sequentially
- Read 30 images one after another.
- Do a disk seek, then read the image
- 30 disk seeks * 10 ms/seek (above table) = 300 ms (to retrieve the images)
- 30 images * 256 KB = 7680 KB = 7.5 MB
- 7.5 MB * 30ms = 225 ms (to read the images)
- total time: 300ms + 225 ms = 525ms
- Parallel
- disk seek + 256kb read = 10 ms + (1MB read time / 4)ms = 10 + 7.5ms = 17.5ms
- Since they run in parallel, there may be variance, realistically double/quadruple
- Still, 60ms is faster than 525ms
Availability
We can define availability as the ability of system to be operational for a set period of time. It’s often measured in percentages, where 100% availability means the service is never down, and 0% being that the service is never up. Usually, availability is between 99% to 100%.
Availability is important for users of our product, so most often, availability is defined on Service Level Agreement (SLA). Cloud providers often define the availability in 99.9% or above. To see in numbers how much we can afford downtime (DT) per a period of time, see table:
| Availability | DT/day | DT/week | DT/month | DT/year |
|---|---|---|---|---|
| 99% | 14.4 min | 1.68 h | 87.31 h | 3.65 days |
| 99.99% | 8.64 s | 1.01 min | 4.38 min | 52.6 m |
| 99.999% | 864 ms | 6.05 s | 26.3 s | 5.26 m |
| 99.9999% | 96.40 ms | 604 ms | 2.63 s | 31.56 s |
Query per second
Let’s put together the numbers used here to quickly get an idea of how to estimate something.
Consider that we want to decide how many queries per second are made on twitter and how much storage is required for that. So what do we need?
Let’s say we want to estimate the storage, for that we need:
- Amount of tweets (text) to store
- Amount of tweets (media) to store
Alrighty, so how do we get that info? Well, we need to know how many users are actually using twitter and how many posts we receive. Without getting specific data, let’s assume the following:
- 300 million monthly active users
- 50 % use twitter daily
- User post twice a day
- 10 % of the tweets contain media
- The data is stored for 5 years
So, let’s calculate number of QPS:
- Monthly, we have 300 million of users, but 50 % use it daily => 300 / 2 = 150 million
- The number of tweets per day is then 150 millions the amount they post per day => 150 2 = 300 million
- But, we want to get that in seconds! So, 300 millions / 24 hours / 60 / 60 => 3472 => ~3500 QPS
- This is an estimate if all goes well. However, since we can have more active users at one moment (double), then we can also deduce the peak being 3500 * 2 => ~7000 QPS
To calculate the storage, we need to know the size of the tweet. Let’s assume it’s build of id, text and media (but there are likely more):
- tweet_id - 64 bytes
- text - 140 bytes
- media - 1 MB
So, to calculate the storage, let’s calculate daily storage:
- 150 millions of users daily with 2 tweets per day where 10 % are with media
- 150 000 000 * 2 => 300 000 000 tweets
- 10 % have media => 30 000 000 tweets with media
- storage per day for regular tweets => 270 000 000 * (64 + 140) => ~55GB
- storage per day for media tweets => 30 000 000 * (64 + 140 + 10^6) (assuming text and media at same time) => 30000 GB
- Note here that massive amount of purely because of media tweets
- To get an idea really fast, we could have just gotten away with media tweets
- Storage per day: 30060 GB => ~30TB
- Storage per 5 years: 30TB 365 5 => ~55PB
Tips for estimating
Notice the last example. The total estimate would be unchanged for the total if we omitted the regular tweets.
- Round and approximate. It’s hard to say what “99987 / 9.1” is, but you can easily deal with “100000 / 10”.
- Write down assumptions to not forget them
- Label units (GB, TB, powers of 2, whatever)
Complete design framework
So, now we have tools at our disposal. We know:
- Why is it important to design system
- What tools are available
- Details don’t matter in estimation (200 bytes vs 1 MB doesn’t make a difference in high level design, deep dive can be done later)
So, how would the entire process go in an interview? Well, let’s look at it:
- We need to understand the problem and get a scope of the issue
- How many users and developers do we have?
- Where are they located?
- How much data is being transferred
- We need to get a high level design so we can deep dive into individual parts later on
- Our system needs a database, so let’s put it in a high level design
- Do we need shards? Where are the databases located? Well, that can be deal with later
- Deep dive into individual parts
- We can deep dive into what specific databases do we use here
- We haven’t covered it yet, but our system expects 10 000 users. What if there are malicious actors that try to break that? We can add rate limiters for example
- And more
- Wrap up
- We’ve gone through a brainstorming and designed a system on a high level on the spot in one hour
- We can review it and see if we think of anything. Is it good enough to try and investigate more? It’s definitely not best, but will it do?
So, we have the individual parts. Let’s cover them now:
Problem & Scope
So, let’s say we have a problem. Let’s say we have to design a news feed system. What information do we need?
- Is it a mobile app or web?
- How many users are we talking about?
- Can the news contain just text, or also images and videos?
- What are we actually building? What is the most important feature?
Now, let’s let’s say the answers are:
- Mobile & Web app
- 10 millions daily active users
- Can contain text, images and videos simultaneously
- The important feature is that user can make a post and see posts of their friends
So, we got an idea. 10 millions DAU, posts can have media and text, and is mobile and web app. But hold on! We thought its news feed, but we are also talking friends! So, let’s clarify some questions:
- We can have friends. How many friends can a user have?
- How should the posts be visible? Do we have some favorites or chronological order?
- Are users in one region or multiple?
Let’s assume the answers are:
- A user can have 5000 friends
- Posts are visible in reverse chronological order
- App is available worldwide
High Level Design
So, let’s start again with the basic design:
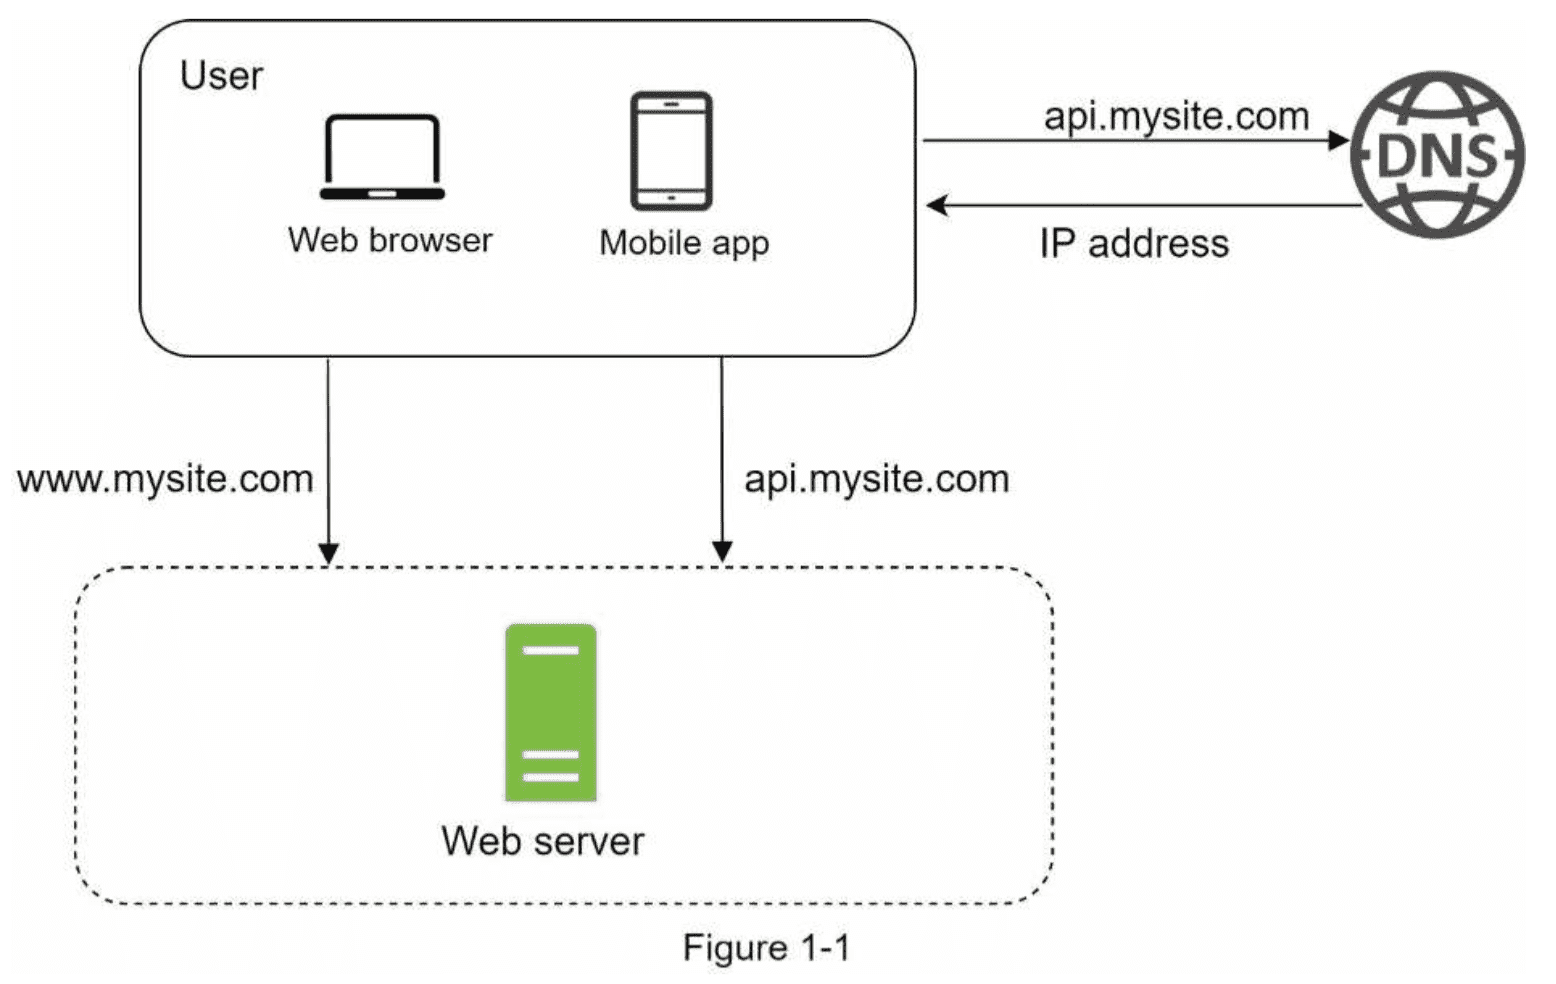
Now, we know the following:
- We have a bunch of users
- Users can have friends
- This means users will be notified to their friends posts
- Users see the data in reverse chronological order
So, we can separate this into 2 problems:
- Publishing a post
- When user creates a post, the data will be written into a database and it will be populated into friends news feed
- Basically a WRITE operation
- Newsfeed
- The news feed is built by aggregating friends posts in reverse chronological order
- Basically a READ operation
So, we have a lot of daily users. What does it mean?
- We need more servers
- Since we have more servers, we need load balancer!
So, we got our base - Web & Mobile app are connected to backend through loadbalancer.
Now, what is happening on the backend? Well, we’ve already mentioned it:
- Post Service dealing with creation of posts
- Fanout Service dealing with populating friends news feed
- Fanout service is short for messaging one-to-many. So basically populating my post to friends feed.
- Notification Service to notify users when something happens
So, let’s put it in a drawing:
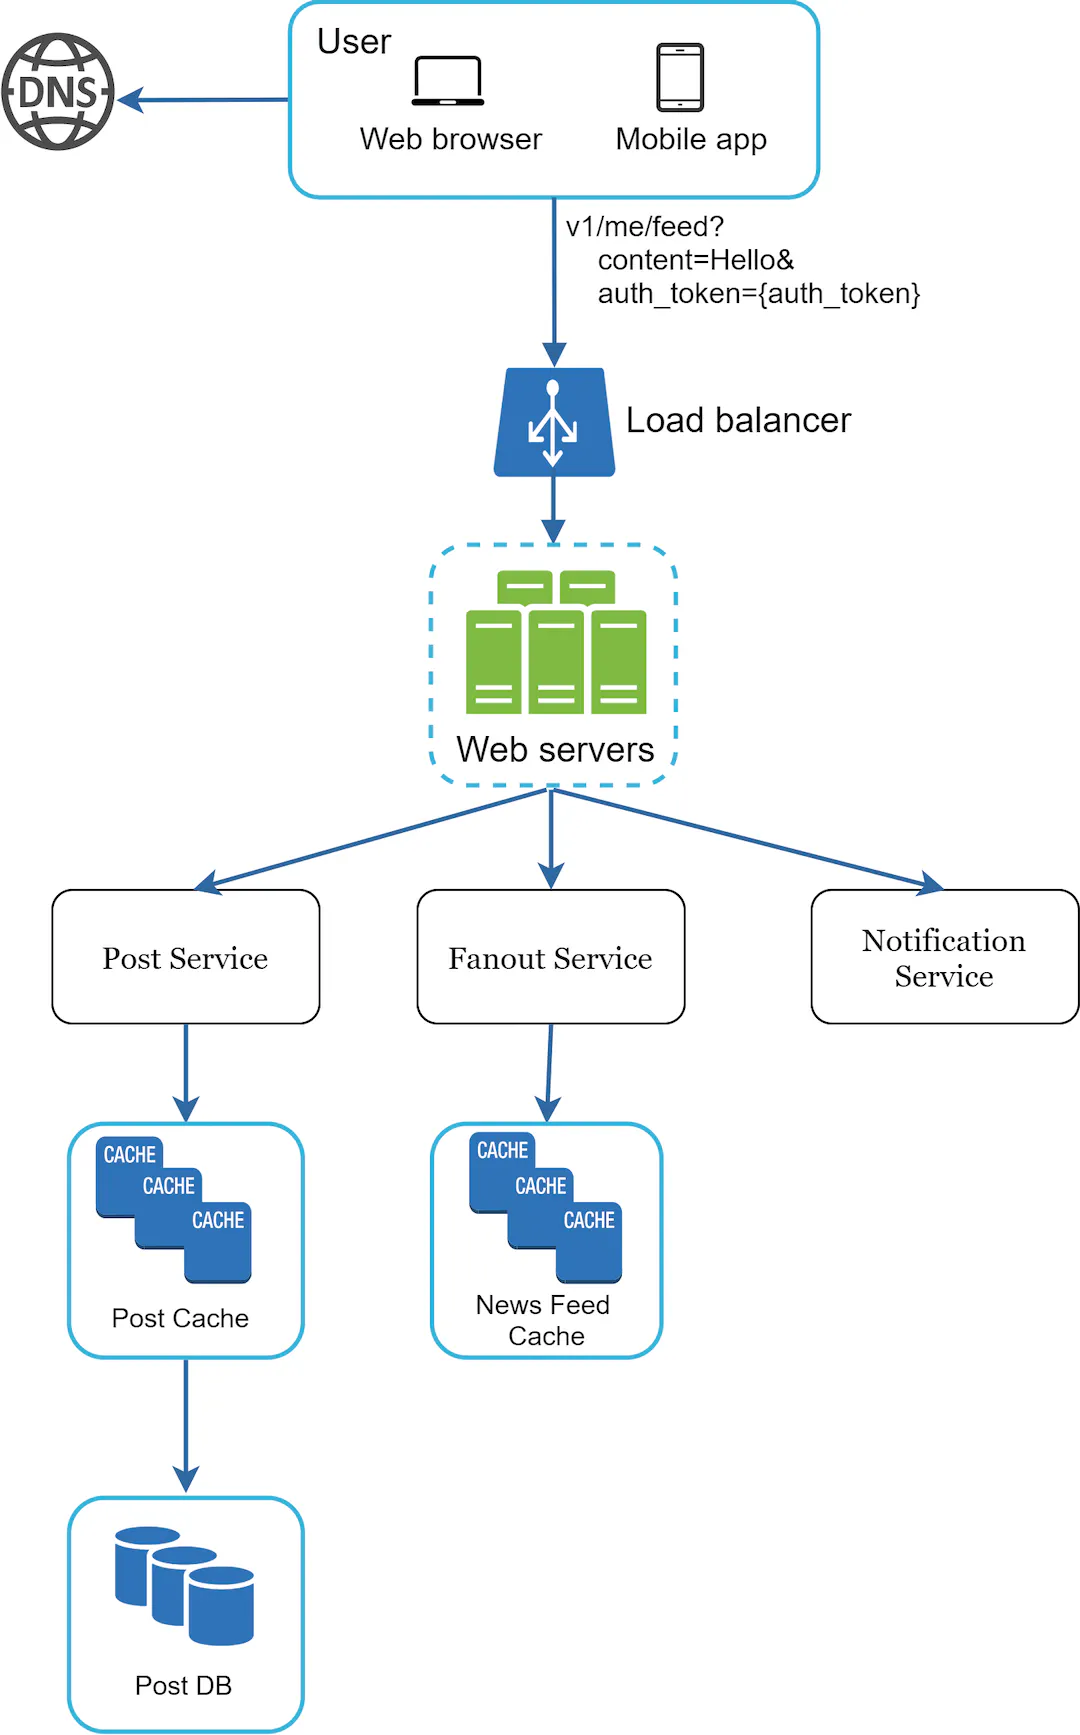
Cool! So we’ve design one part of it. We now have posts and are able to save them. But what about the news publishing itself? Sure, we could just load them all from the database of posts. But that might be a little problematic as it’d be overused. So, let’s create a separate service for that.
So, we now need only to read the data. I’m going to assume that the posts don’t change often - I haven’t changed my post on twitter for some time after all. Because we actually don’t need a DB here. We can read the data from the posts, sure, but this data is a good candidate for just using cache. It’s faster, remember?
It can look something like this:
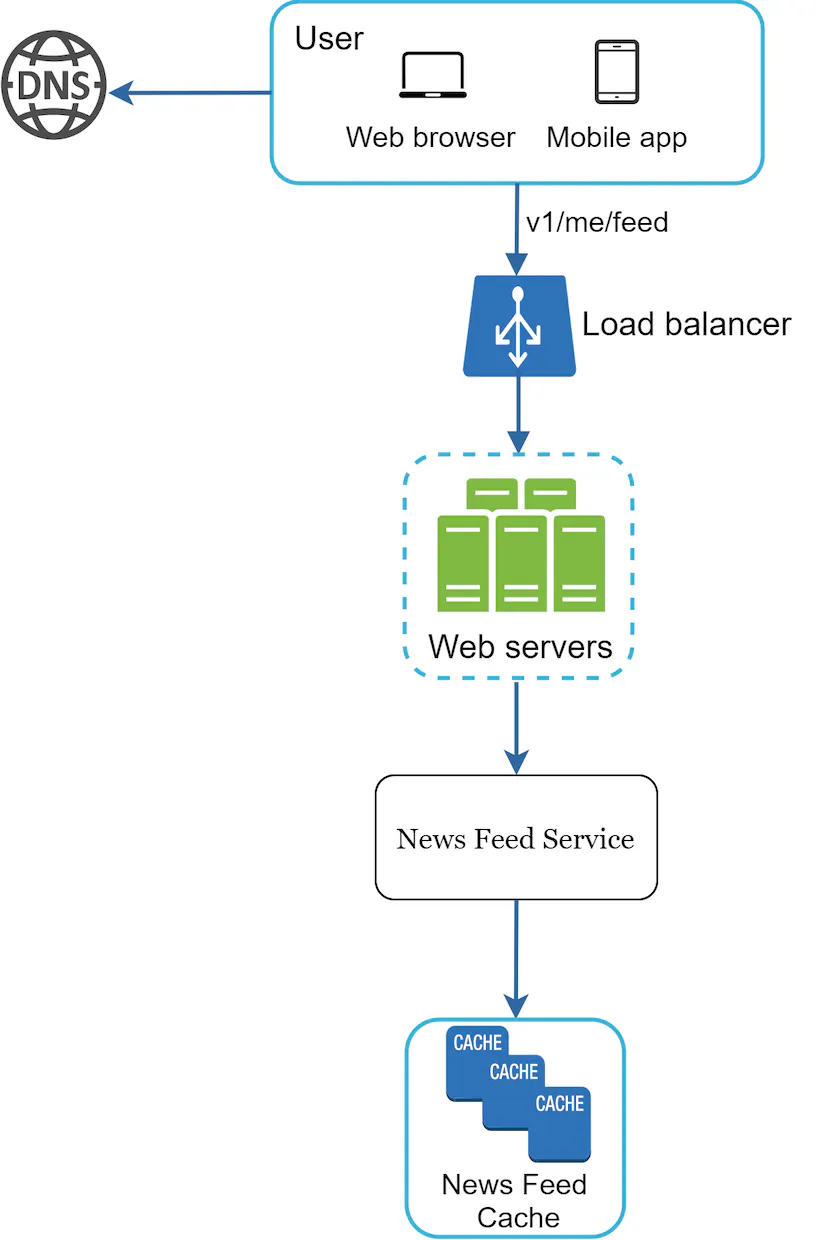
And that’s it! For high level design, this is fine:
- We have load balancer and multiple servers to support a lot of users
- We have multiple services so that they can deal with the tasks themselves - one for read operation, one for write, one for distribution
- We are caching the data because existing data are not changed often, and we have fanout service for publishing new posts.
Design Deep Dive
So, now we should be having some feedback from our colleagues when designing. We’ve agreed on goals and scope. We have a high level design. What’s next?
Now we will look at the individual parts. Let’s consider the first design for feed publishing:
- We have a post service
- We have a fanout service
- We have a notification service
- They all receive commands from web servers
- We have a load balancer
What can we do more here? Well, we have a bunch of millions of users and our tool is built for them. We have some expectations for the amount of daily users. What we don’t know is the number of posts they will do per day. And we can also expect that they won’t do a post every millisecond.
But they can! And that’s the problem. So, let’s add a rate limiter. We will design one in the next chapter, but for now, rate limiter is just that - limits the number of times users can use our tool.
Another thing is we don’t have authentication in there! So let’s put it in. Only authenticated users can crewate posts!
We can’t do much more about the post service itself at this point. Of course there can be ideas
- We can completely separate it and have more webservers on that
- We can add rate limiters to that service as well
But, at this point, I’m happy with just cache and database. It should be reasonably fast.
But the fanout service can get better. Right now we just get data from cache. But:
- We know we have friends
- We want to new posts into their news feed
So, let’s get friends data! The Fanout service will now retrieve data of our friends. And since there can be many, let’s use a graph DB for that! Graph is a really good tool for this. After all, a social network is a graph.
And finally, we can have a bunch of different workers to support it, because we need to get a single post into quite a lot of places (friends feeds). So, let’s create some workers for it and have them consume a message queue. As discussed in part 2, we can reasonably scale that part.
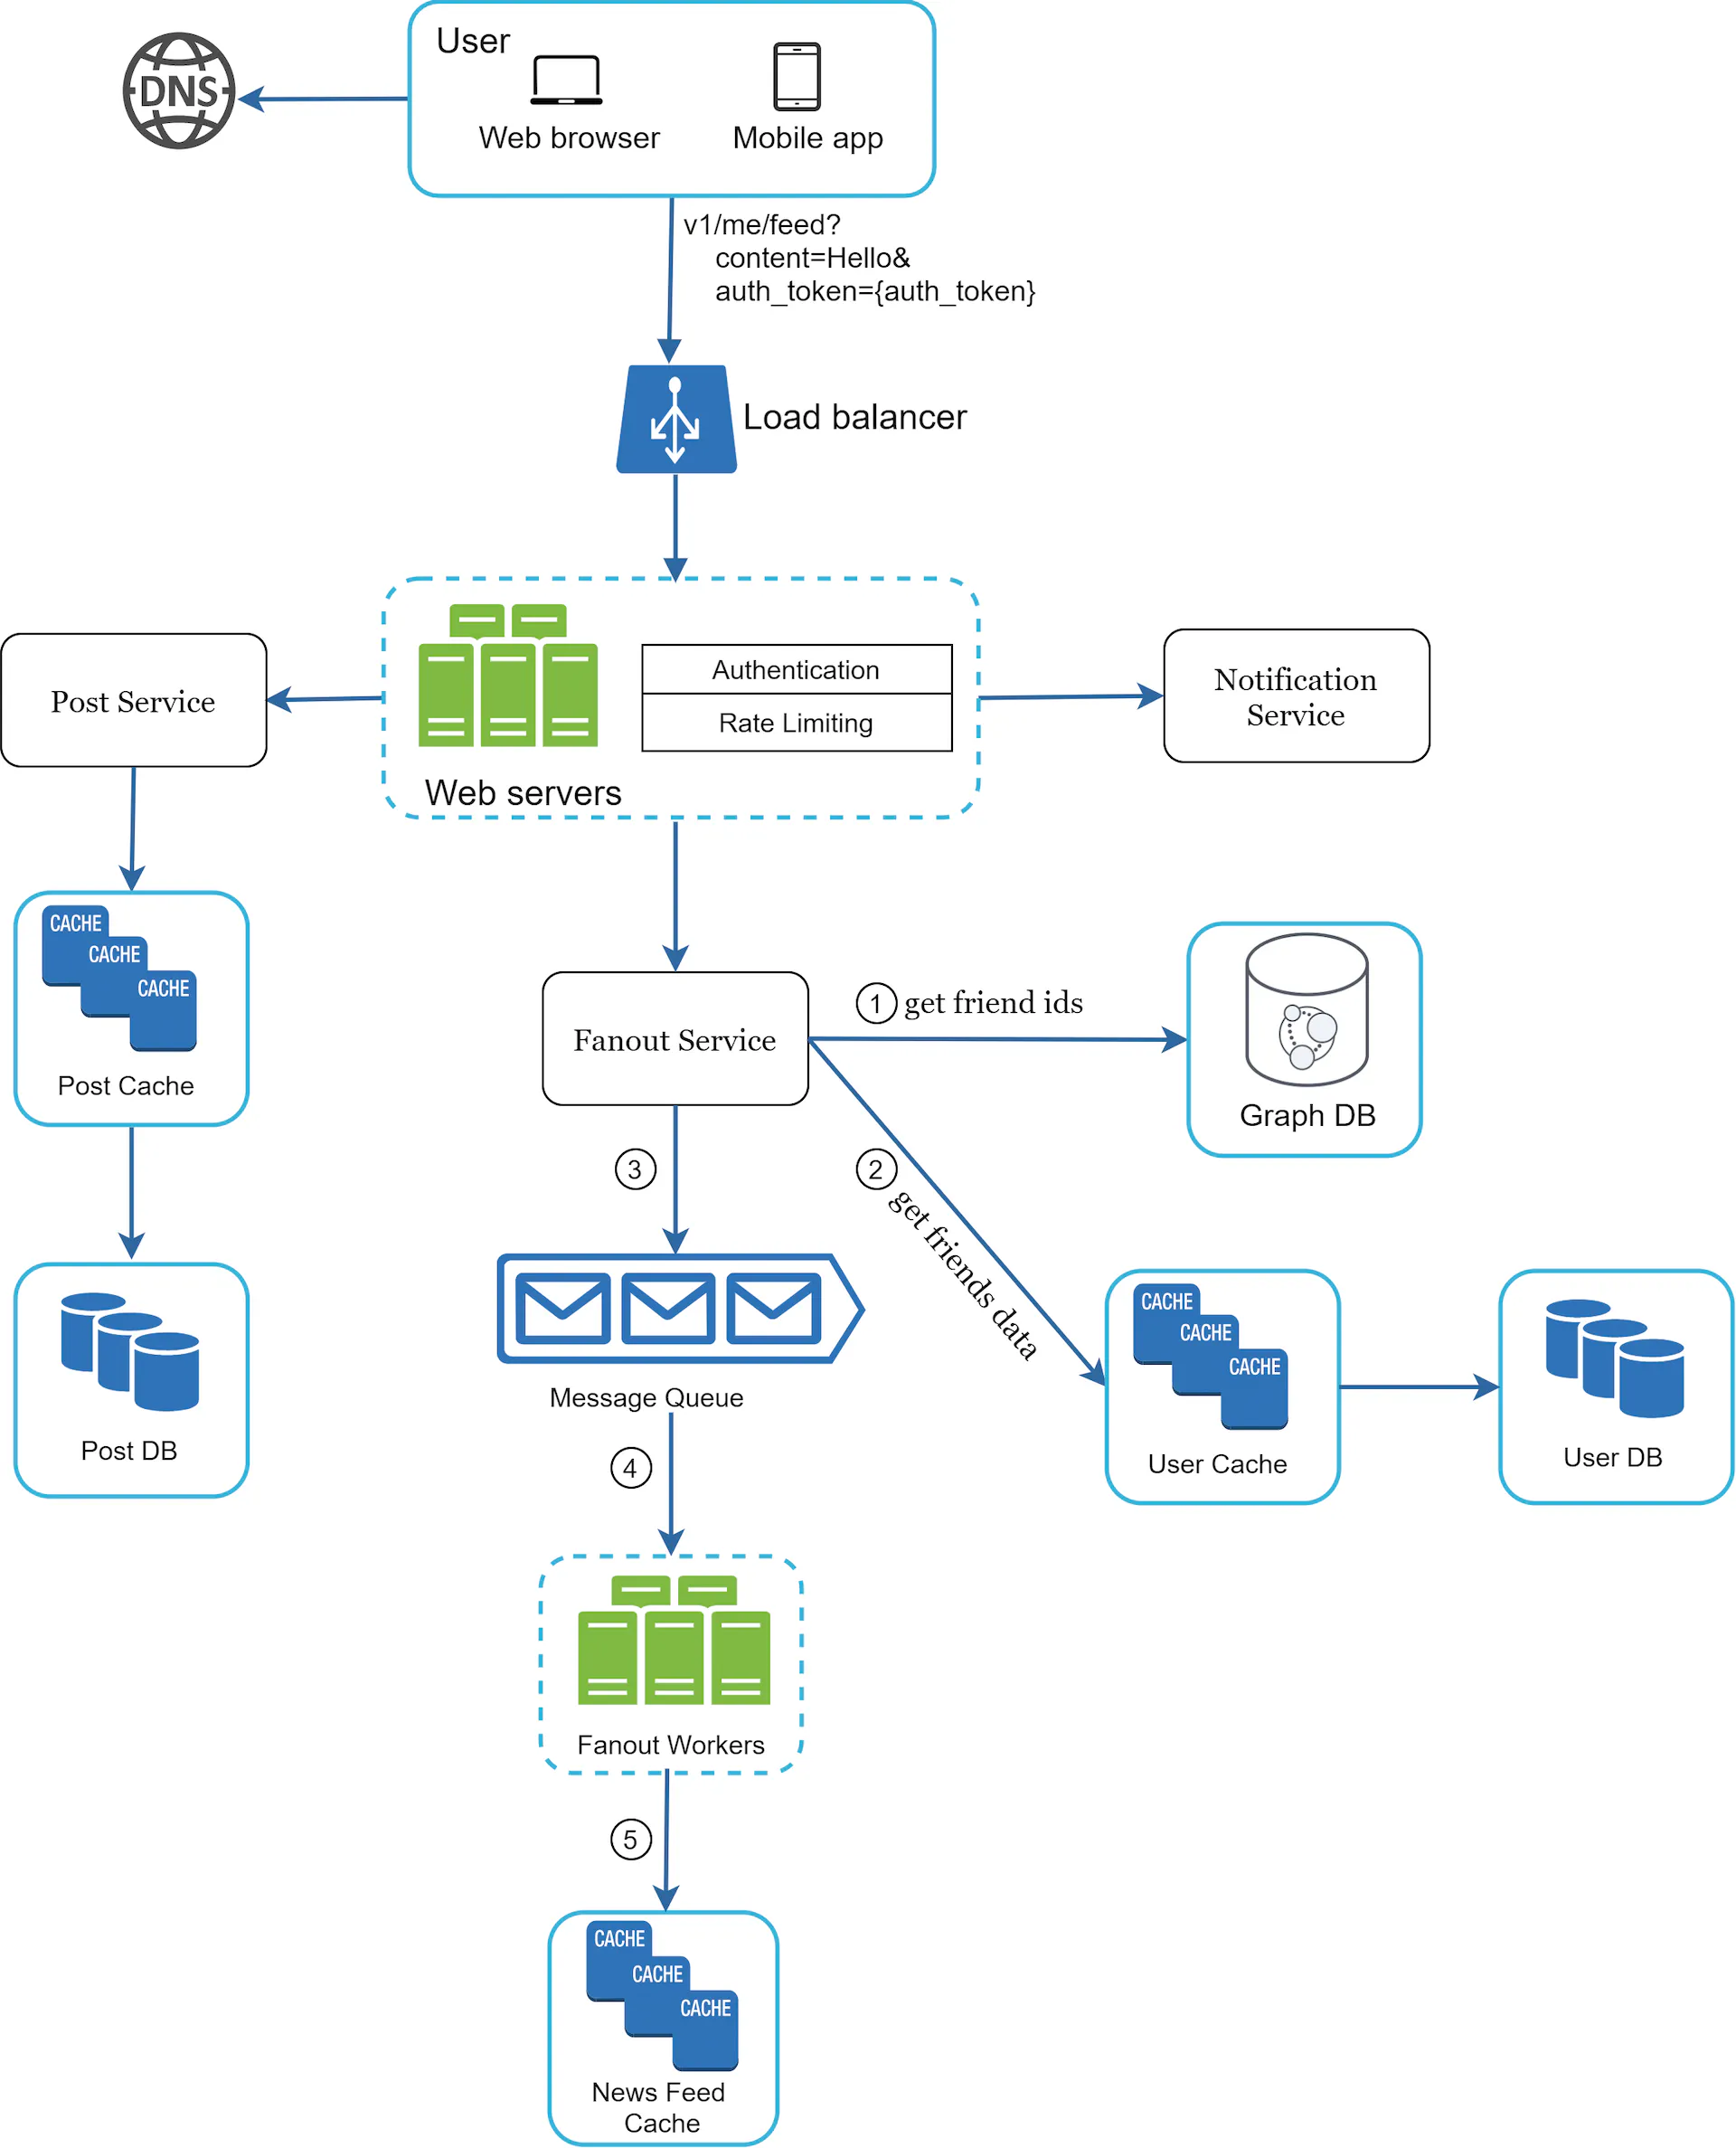
Great! We’ve done some progress on feed publishing. But what about retrieving the news feed? Well, we know that we have a bunch of databases now.
- Post DB (published posts)
- User DB (friends)
Furthermore, the news feed service can get quite a bit of static assets. Because a single post is visible to many people, we can keep the assets shared somewhere else. What’s good for that? A CDN!
Previously, we’ve just retrieved data from cache. But that data can get stale. So, let’s get the data from the actual databases as well!
So, let’s add this all together:
- We’ll use the user and post cache we’ve created in previous post publishing deep dive
- We’ll also setup authentication and rate limiting.
- We’ll setup a CDN
Great! Let’s see our final design:
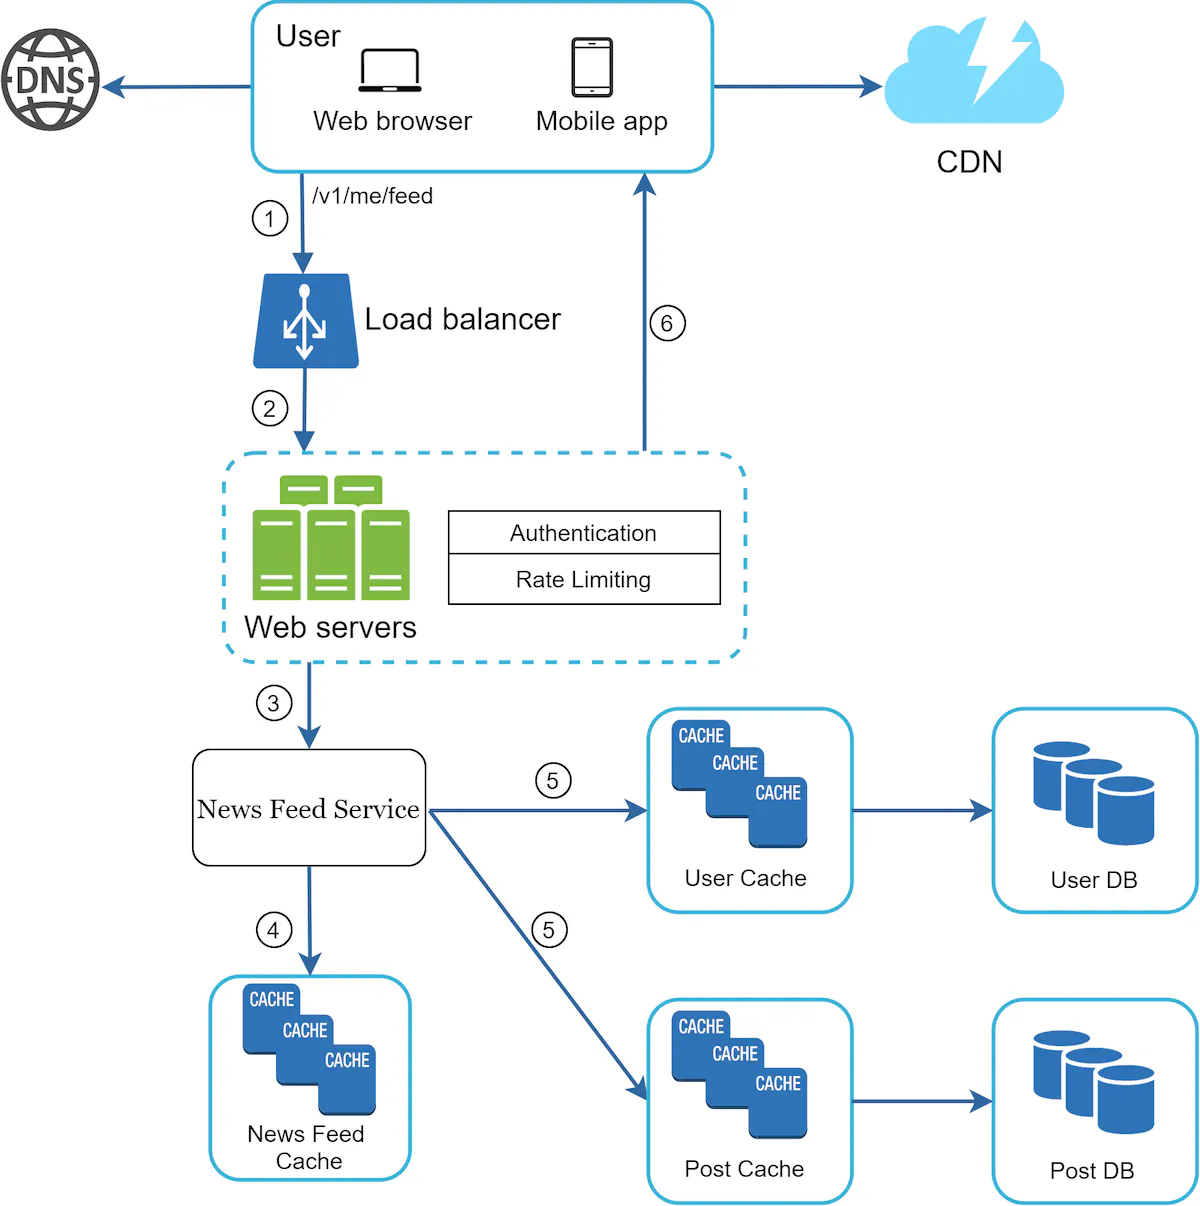
Wrap Up
Let’s wrap it all up now!
- We’ve quickly created a news feed service and post publishing service
- We started off with a high level design and later added rate limiting, authentication, CDN and more performant databases for our use case
- We’ve also added a CDN for static contents
Now, is there something to be improved? Well, definitely!
- For starters, we have a system for 10 million DAU, but we do not have any logging, metrics, anything to indicate our systems are working or not
- How do we handle error cases? What if a DB fails? We didn’t go through redundancy, that might be something interesting!
- What if we want to support more users? Rather than 10 mills, what about 100 mills? Would it suffice?
- How do we deploy changes to the system? We haven’t tackled that
In all of these parts, we could spend a long time. But that’s not the purpose of initial system design. We can get into details when we actually start imolementing it.
Summary
So, at this point, we’ve established what a good process for designing a system is. The important takeaways in my opinion are:
- Estimate and approximate. When designing a system, we know roughly how many users. But we don’t know exactly
- Does it make a difference if it’s 90000 or 100000? Well, it probably does eventually, but not at high level design point
- We can always make everything specific once we decide to actually roll it out
- Go deep after you’ve gone broad. First, come up with something high level.
- When you write code, you don’t do everything at once. You iterate, learn from previous mistakes. Do this here.
And finally - have fun with it. Designing a system with someone is a thought process. Bounce off one anothers’ ideas.
References

